Rigidity of the LHiRes III
1 Extreme Positions
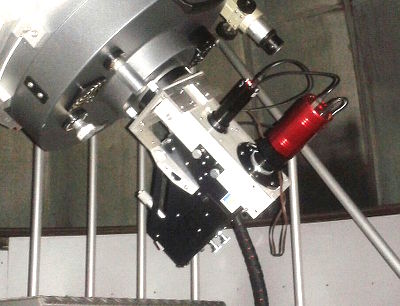
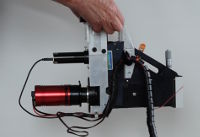
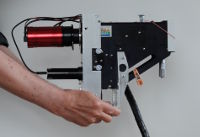
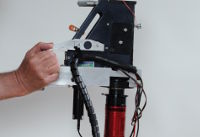
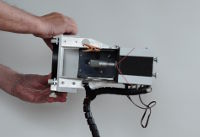
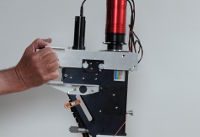
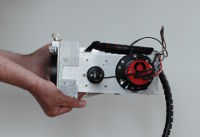
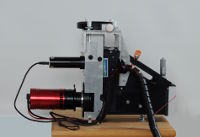
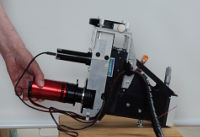
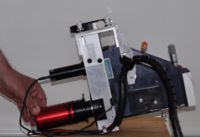
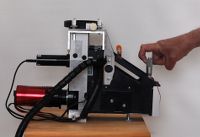
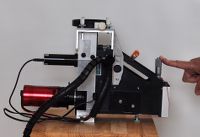
My LH3 is mounted on u-shaped aluminium profile. A mounting plate with an adapter that fits the Meade 16" SCT thread combines the framework thight with the telescope. For the following experiments the LH3 was not mounted on the telescope but I mostly grasped its mounting plate by hand and turned the spectrograph around to various extreme positions.
There are four different groups of tests. In the first two groups I rotated the LH3 around the optical axis of the incoming beam. In the third group the LH3 stands on a table. And at last I manipulated the micrometer.
- vertical axis
- horizontal axis
- the spectrograph stands on the table
- a force onto the micrometer to and fro.
Some frames were produced with the LH3 to every of the four items.
- bottom, top
- north, east, south, west
- resting on table, ccd lifted, ccd pressed down
- push and pull
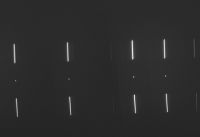
The distortion of the spectrograph is measured with the help a slit from Sheliak that carries a hole of 19 µm diameter. The slit was illuminated with the build in neon lamp. A two dimensional gauss curve was fitted on the selected dot in every frame to record the position on the chip. The displacement will surely depend on the grating constant. I use only a grating with 1800 l/mm in this investigations.
The CCD Atik 460EX is delivered with a Sony ICX694 chip with square pixels of 4.5 µm edge length. So we can measure the displacement of the selected peak independent from the pixel size of the ccd we use. Reference point in the following figure is the position of the peak when the LH3 rests on the table.
Since the wavelength axis is roughly the x axis we are pleased to see the distortion in this direction smaller then perpendicular to it. The outlier in pushing the micrometer does not affect adversely the normal use of the LH3. The next section will show more realistic measurements with the LH3 mounted on the telescope.
2 Distortions At The Telescope
To gain more realistic values for the distortion the LH3 was mounted on the telescope with the slit parallel to the rectascension direction. The connection to the telescop is not tested in this measuring because I do not know how to determine the optical axis of the telescope regardless where the telescope is pointing at the sky.
2.1 Moving In Declination
I started with the telescope looking at some point at the eastern horizon and moved it in steps of about 15 degrees through the celestial north pole to the horizon at the opposite side of the mounting. I could not stop the RA motor during the measurements.
The maximum shift in wavelength direction (X) is about 15 µm. During the move from eastern horizon to western it starts at -8 µm rising to 7 near the celestial pole an falls back to -7 µm near the western horizon. Measured relative to the mean position of the selected peak on the chip.
The move in Y direction is slightly smaller. It falls continuosly from 5 µm to -3 µm with mean value reached at the celestial north pole.
2.2 Moving in RA Direction
Again I started at some point at the north eastern horizon at RA 21 h and moved in steps of about 1 h in rect ascension. The meridian flip was at 11 h and I continued moving to the north western horizon.
The result is shocking.
The maximum shift in wavelength direction (X) is about 63 µm. Again the move in Y direction is slightly smaller: 42 µm. With the Atik460 this means 14 px rsp. 10 px.